|
As we just know, plate tectonics is a theory that has been developed to explain Earth's geosphere movement.
How do we know geosphere is moving and has moved over the time? Geologists as Alfred Wegener have study this over the
time. When firsts theories developed, scientists used a great vareity of evidences to support their theories. The theory that
once all continents were only one today called Pangaea and that they have move during the time until they riched their actual
position is called "Continental drift.
|
| Continental Drift |
Continental drift is supported by another theory called "Sea-floor spreading". This theory explain that magama spread
out to sea floor by the mid-oceanic ridges. When magma goes out, water cools it down, making of it new crust or floor. This
new floor pushes older one to the sides away from the mid-oceanic ridges. Older floor goes back to the Earth's interior and
heats up in the trenches. Magma goes in and out the interior of the Earths thanks to the convection currents inside Earth.
|
| Sea-floor spreading |
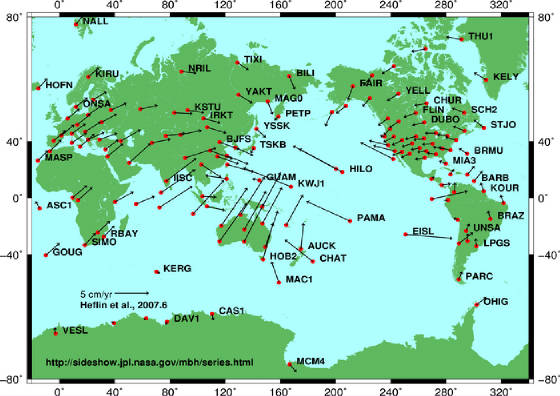
Actually, there is evidence that geosphere is moving. GPS data has been recorded during years. It shows the movement
of its stations with arrows wich show the wich way and the how fast this stations are moving.
|
| GPS map |
For example, I'm going to take 2 stations from the map and show you the movement of it.
|
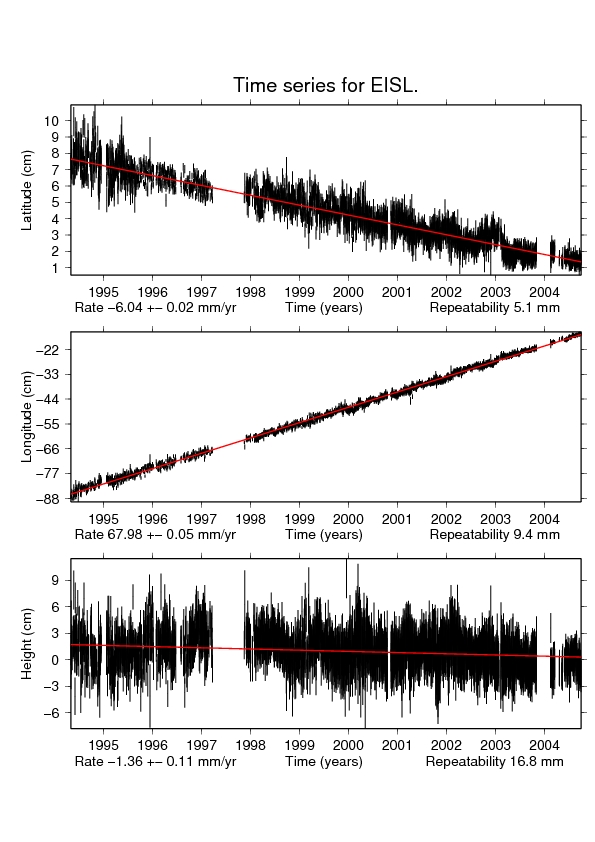
The previous graphics show the movement of the EISL station during the last 11 years. As you can see in the map, this
station has a big arrow (what means that it has move a lot) that points to the south-east (wich is the direction of its movement).
{The first graphic shows the north/south movement. The second shows teh east/west movement. The third shows the changes
in elevations.}
As you can see in the first graphic, the line of records seems to be moving south. It means the station is moving south.
The second graphic shows that the station is moving east. The third graphic shows that the elavation has decreased.
|
|

These ones show the movement of the KERG station. As you see in the map, its arrow is a very little one pointing
clearly to the south-esat. The first graphic shows a south movement. The second, a east movement. And the third graphic shows
tha its elevation hasn't change during the last 11 years.
|
|